
[Editor’s note: We’ve partnered with the National Consortium for the Study of Terrorism and Responses to Terrorism (START) to publish a series of infographics based on data from their Global Terrorism Database and related START projects. Each week we’ll release a new set of graphics that depict trends in global terrorism activity. Sign up for the War on the Rocks newsletter to make sure you don’t miss any of them!]
These graphics were designed by Michael Jensen and William Kammerer.
Last week we published a series of graphics that combined to provide a picture of terrorism in Latin America. This week we look at another region that is often underrepresented in mainstream narratives about terrorism, but where terrorist violence represents a serious and pervasive challenge: Southeast Asia. Each of these five graphics portray a different aspect of terrorism in the region, and each is followed by a set of notes of particular interest. The first graphic is a snapshot of terrorism in Southeast Asia in 2013.
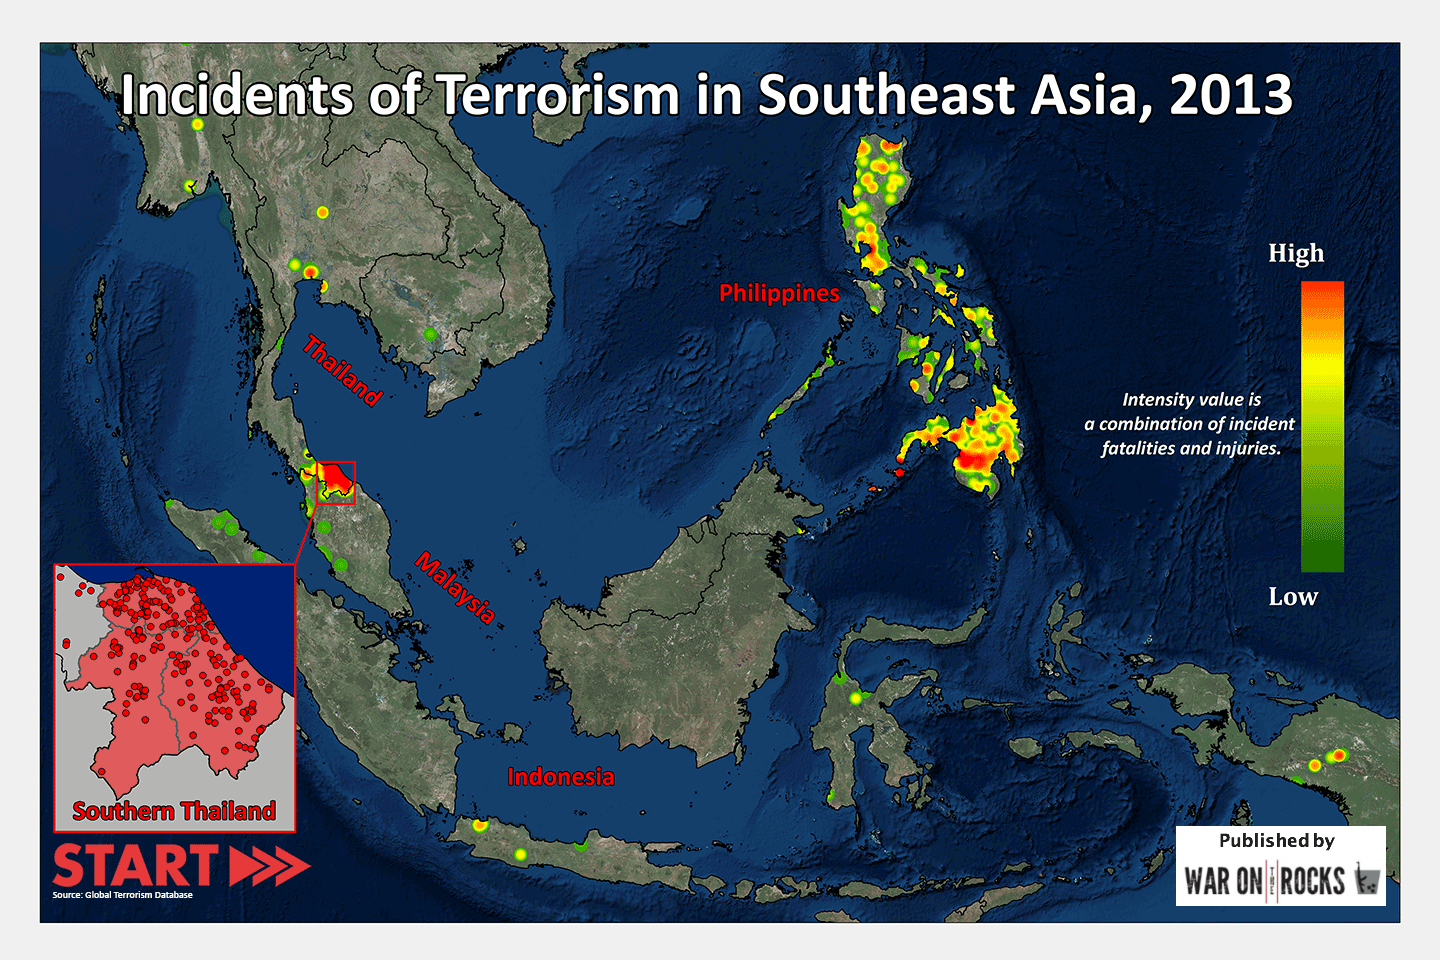
Incidents of Terrorism in Southeast Asia, 2013 (click to enlarge)
- Southeast Asia was the third most active region in the world in terms of terrorist attacks in 2013, with nearly 1200 attacks occurring in the region.
- The vast majority of terrorist violence in the region in 2013 took place in two countries — Philippines and Thailand. Violence in those countries accounted for 95% of the attacks the occurred in the region for the year.
- As the graphic shows, violence in Thailand was primarily isolated to the southern part of the country, where a number of groups have been waging a separatist war since the mid-2000s.
- Violence in the Philippines was dispersed broadly across the country, and was driven by a number of groups with various goals. Some, like the Bangsamoro Islamic Freedom Movement (BIFM) and the Moro Islamic Liberation Front (MILF), are separatist movements based on ethnicity and religion, while others, like the New People’s Army (NPA), are broader nationalist organizations driven by leftist ideologies.
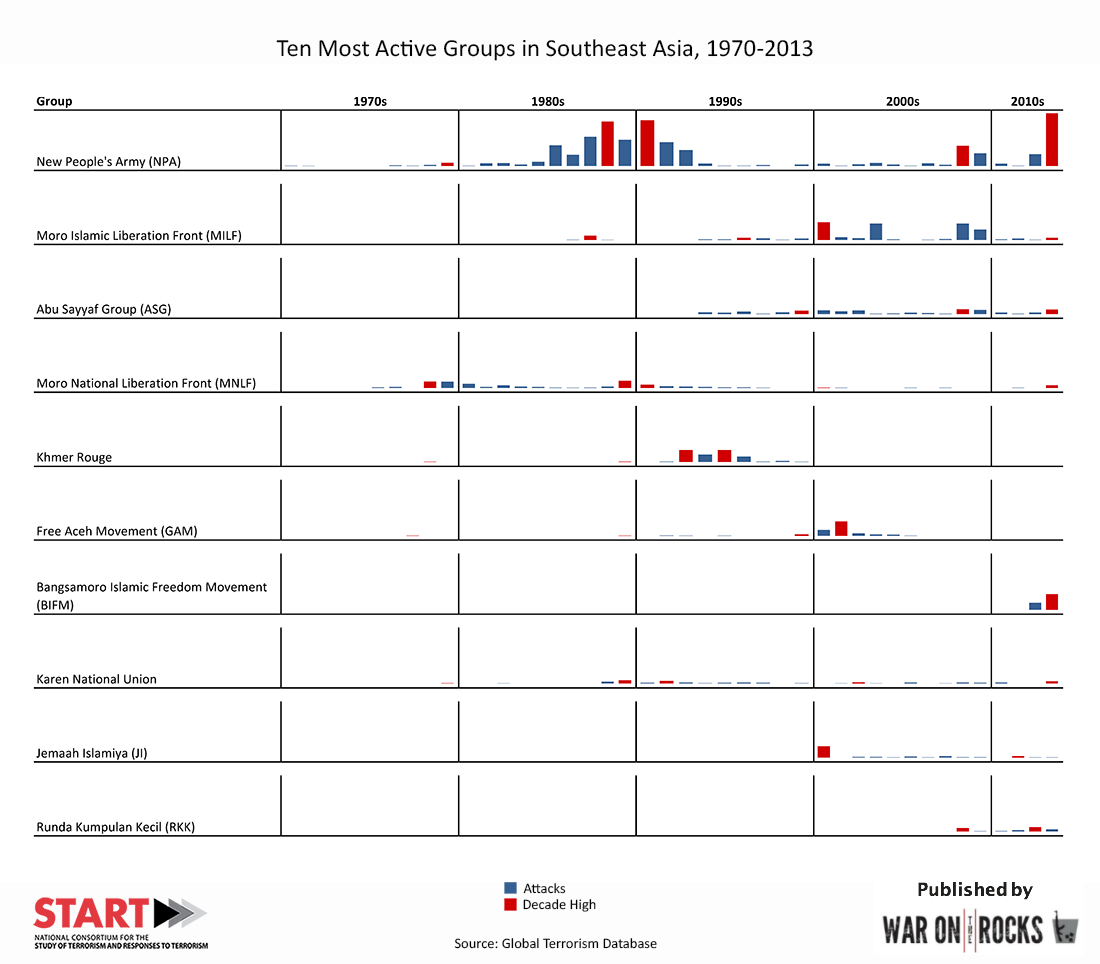
Ten Most Active Groups in Southeast Asia, 1970-2013 (click to enlarge)
- Five of the ten most active groups are primarily active in the Philippines. With that said, it is important to note that attacks in Thailand are rarely claimed by, or attributed to, specific groups. Thus, the prevalence of Philippines based groups on the list is driven in part by a lack of information about the activities of particular groups in Thailand.
- The New People’s Army stands out on the list as the most active group in the region. In fact, in 2013, the NPA committed more than three times the number of attacks as the next most active group in the region — BIFM.
- In addition, the NPA has been active longer than any other group on the list. The organization formed in 1969.
- The majority of the most active groups in the region, including the NPA, have experienced the peak of their activity since 2000.

Ten Most Active Groups since 2010 by Attacks and Average Fatalities (click to enlarge)
- The graphic charts both the raw number of attacks for each group during this period, as well as the average number of fatalities that were caused in each of those attacks.
- The NPA ranks as the eighth most active group in terms of number of attacks since 2010. However, NPA attacks caused fewer fatalities on average (.83 per attack) than any other group on the list. This trend is driven in part by the group’s preferred attack methods, which are charted in the next graphic.
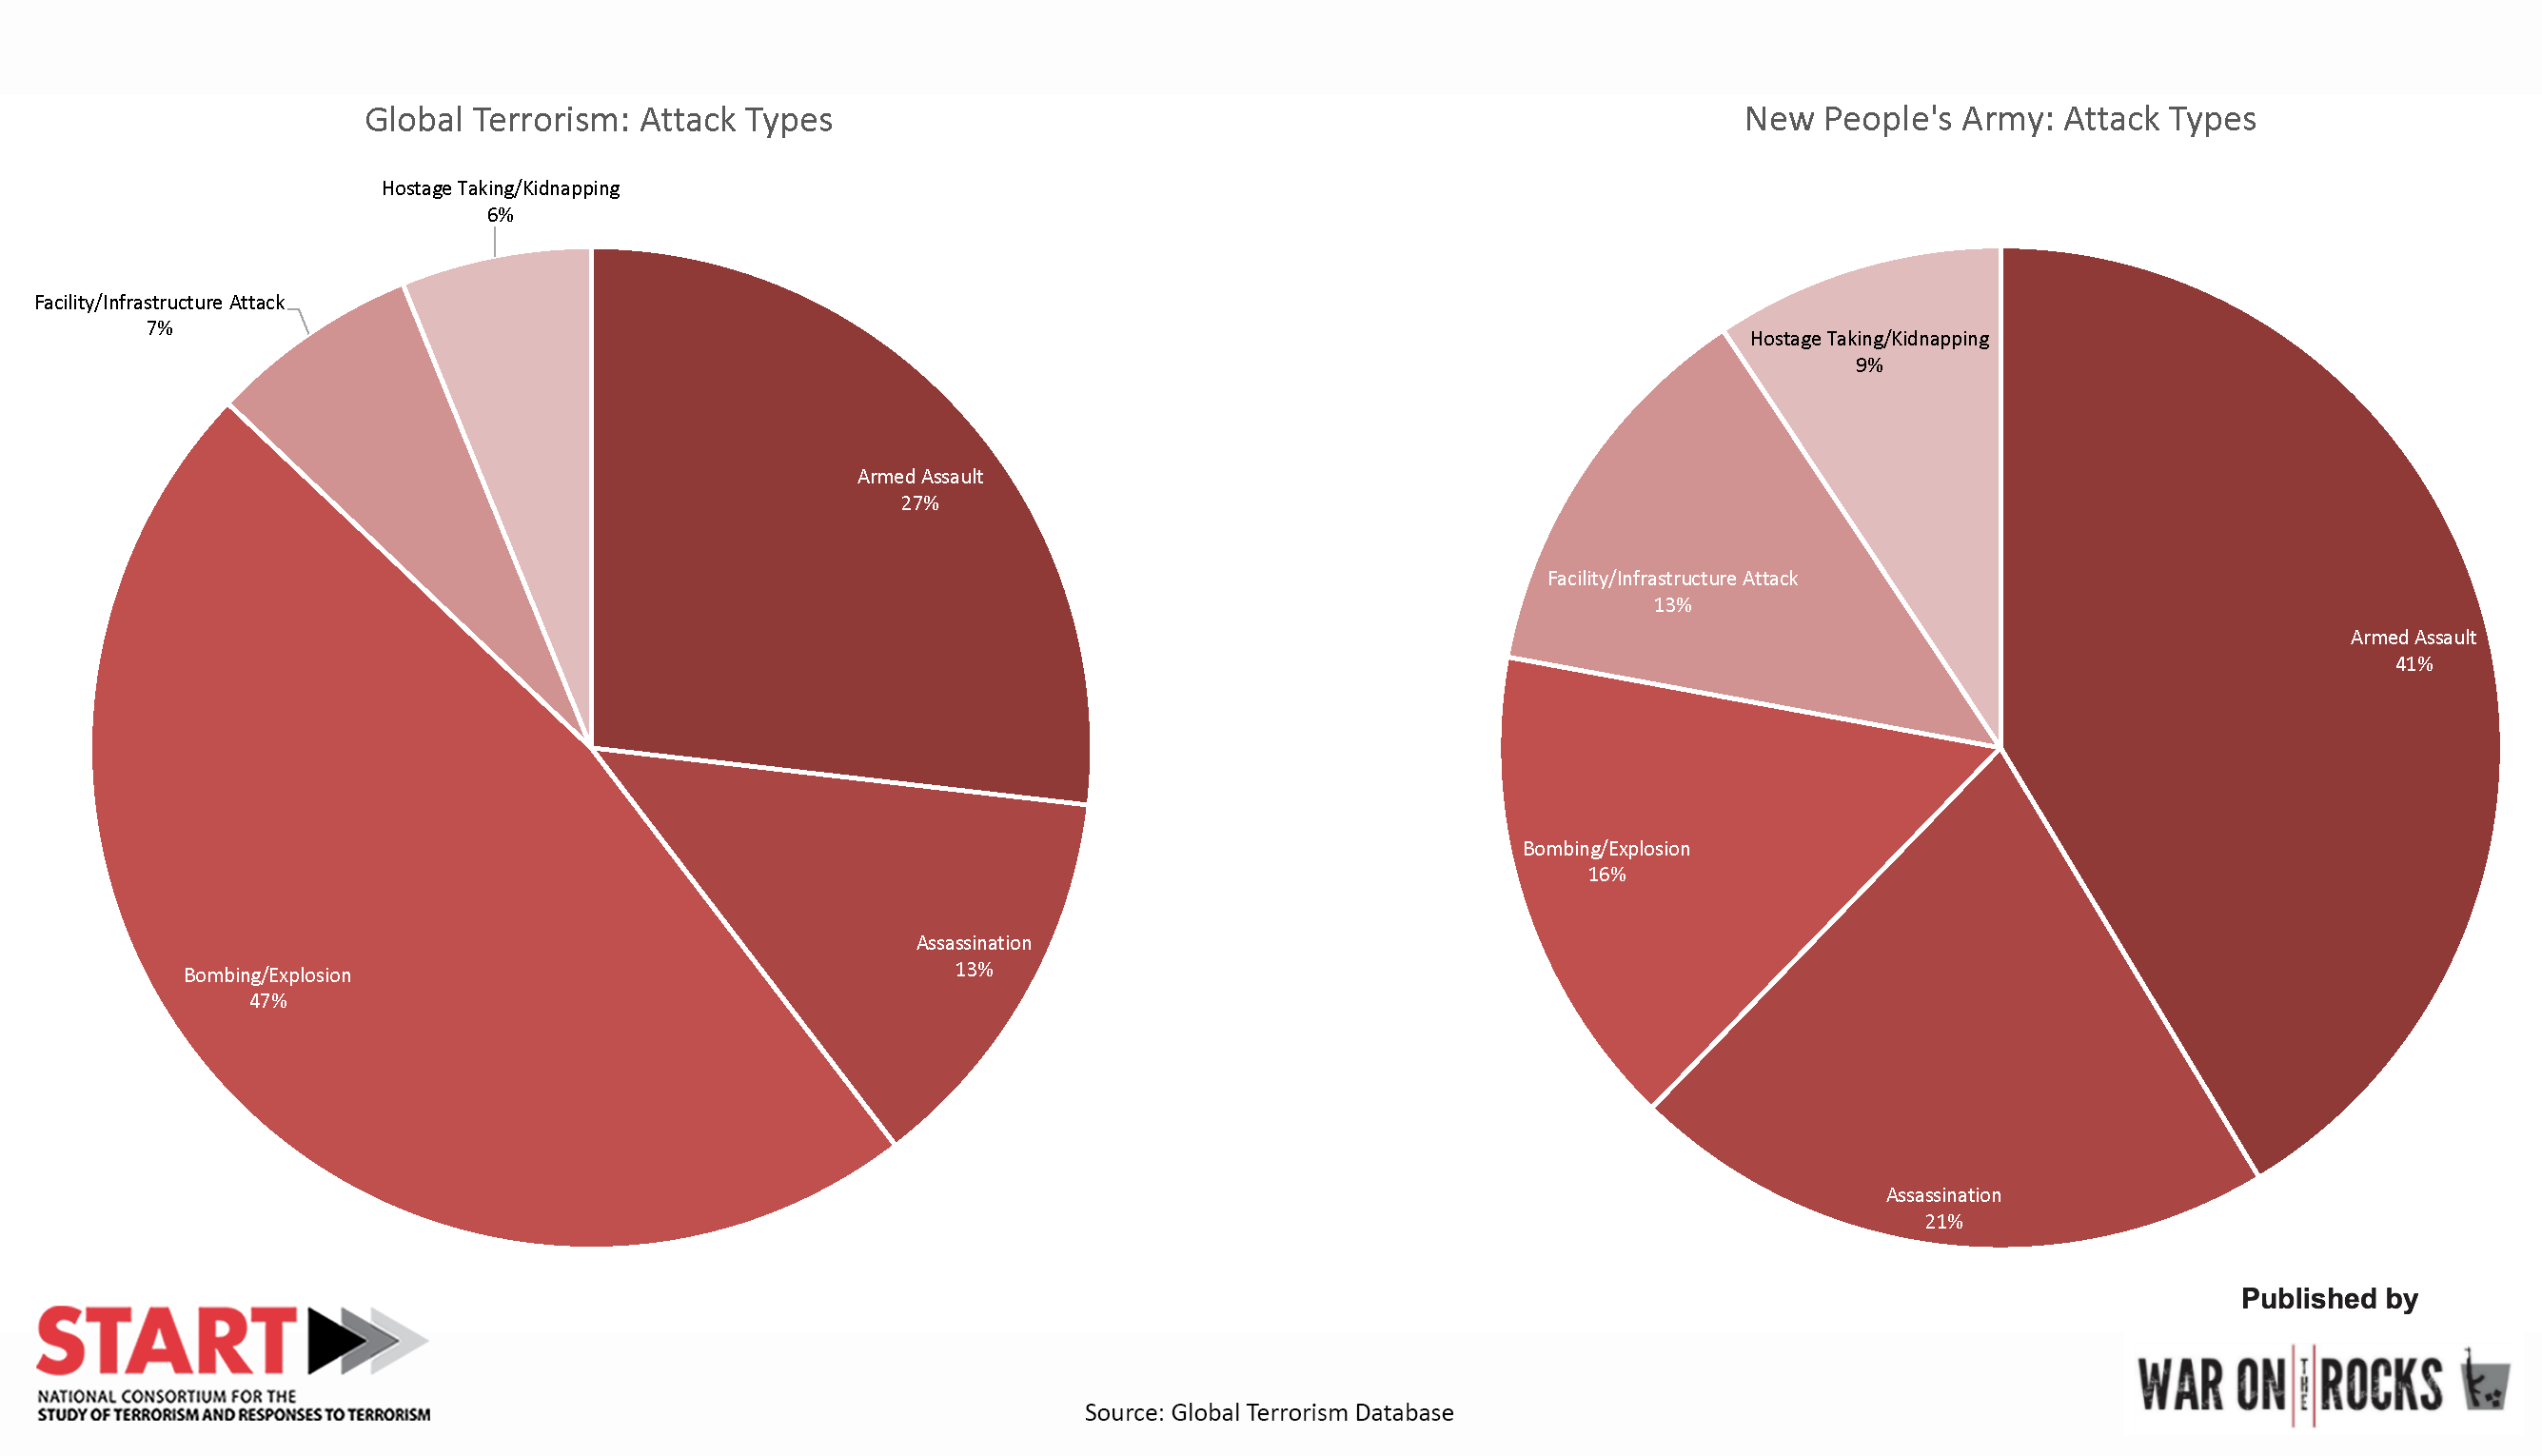
Attack Methods since 1970, Global Average Versus NPA (click to enlarge)
- One of the reasons why NPA attacks tend to cause fewer casualties than other active groups is the group’s relatively small reliance on bombings and its avoidance of suicide attacks as attack methods. As we mentioned in an earlier infographic series, suicide attacks kill far more people on average than any other attack type.
- In fact, the three groups with the lowest fatalities per attack — NPA, the Communist Party of India-Maoist and the Revolutionary Armed Forces of Colombia (FARC) — all avoid the use of suicide attacks in their campaigns.
- The NPA has instead committed an unusually high number of armed assaults, many of which have been non-lethal.

Target Selections since 1970, Global Average Versus NPA (click to enlarge)
- As you can see, the NPA tends to target the military more and private citizens less than the global average.
- In this regard, the NPA’s behavior seems to reflect the finding that leftist groups target civilians less than other types of organizations, especially Islamist groups. This is an idea that we will examine in more detail in an upcoming infographic set.
Notes:
This graphic is based on preliminary data that is subject to change. 2013 GTD data is not yet available for public download or distribution. It will be released via the GTD website later this summer.
Beginning with 2012 data collection, START made several important changes to the GTD collection methodology, improving the efficiency and comprehensiveness of the process. In general, comparisons of aggregate statistics over time and between locations should be interpreted with caution due to these methodological improvements, as well as the considerable variation in the availability of source materials.
[Michael Jensen is the data collection manager for the Global Terrorism Database at START.]
http://warontherocks.com/2014/07/infographic-terrorism-in-southeast-asia-serious-violent-and-unique/
No comments:
Post a Comment
Note: Only a member of this blog may post a comment.